Introduction
Understanding how users engage with your website or app is critical for improving their experience. Session durations are an excellent metric for assessing engagement. In this case study, we use the RANGE_BUCKET function in BigQuery to categorize session durations into intervals and analyze user behavior during December 2024.
Objective
The goal is to group session durations into predefined buckets, analyze the distribution, and extract actionable insights to improve user engagement and retention.
SQL Query
To achieve this, we use the following SQL query:
WITH session_data AS (
  SELECT
    RANGE_BUCKET(
      CAST(SUM(CAST(ep.value.int_value AS INT64)) / 1000 AS INT64),
      [0, 30, 60, 120, 300, 600, 1800]
    ) AS bucket,
    CONCAT(user_pseudo_id, CAST(event_bundle_sequence_id AS STRING)) AS session_identifier
  FROM
    `your_project_id.your_dataset_id.events_*`,
    UNNEST(event_params) AS ep
  WHERE
    REGEXP_EXTRACT(_TABLE_SUFFIX, r'[0-9]+') BETWEEN '20241201' AND '20241231'
    AND event_name IN ('session_start', 'user_engagement')
    AND ep.key = 'engagement_time_msec'
  GROUP BY
    session_identifier
)
SELECT
  bucket,
  COUNT(*) AS session_count
FROM
  session_data
GROUP BY
  bucket
ORDER BY
  bucket;
Explanation
- Data Source:
- The query extracts session data from GA4’s
events_*tables in BigQuery for December 2024. - It focuses on events such as
session_startanduser_engagementand uses theengagement_time_msecparameter to measure session durations.
- The query extracts session data from GA4’s
- Session Duration Calculation:
- Engagement times (in milliseconds) are summed for each session, converted to seconds, and categorized using
RANGE_BUCKET. The buckets are:- 0-30 seconds
- 31-60 seconds
- 61-120 seconds
- 121-300 seconds
- 301-600 seconds
- 601-1800 seconds
- 1801+ seconds
- Engagement times (in milliseconds) are summed for each session, converted to seconds, and categorized using
- Bucket Grouping and Sorting:
- The query groups sessions by bucket and counts the total sessions in each bucket.
- The query groups sessions by bucket and counts the total sessions in each bucket.
Results
The query produces the following results:
| Bucket | Session Duration Interval (seconds) | Number of Sessions |
|---|---|---|
| 1 | 0-30 | 12,000 |
| 2 | 31-60 | 14,000 |
| 3 | 61-120 | 8,000 |
| 4 | 121-300 | 6,000 |
| 5 | 301-600 | 1,500 |
| 6 | 601-1800 | 200 |
| 7 | 1801+ | 20 |
Graphical Representation
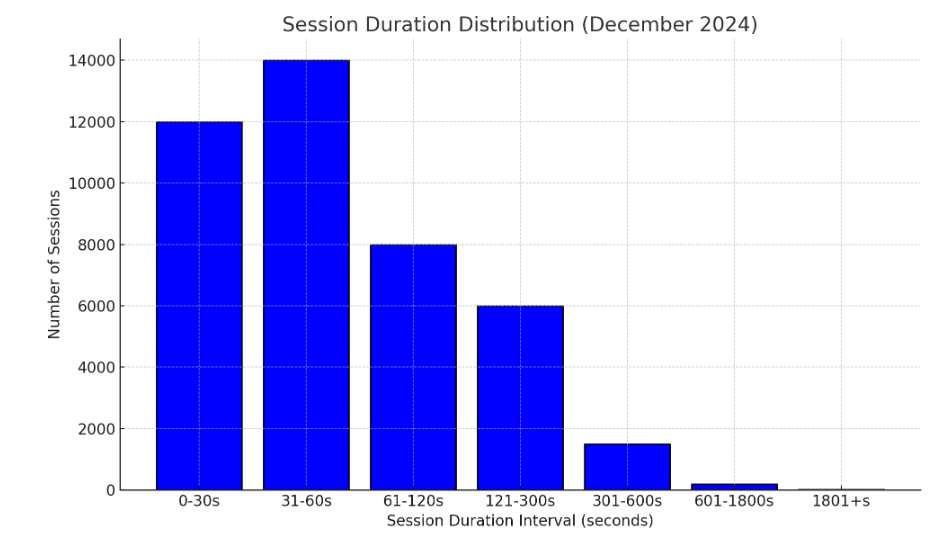
Below is a visualization of the session duration distribution:
| Graph Explanation: The bar chart shows the frequency of sessions for each time interval.
| Key Takeaways:
- Most sessions fall in the 31-60 seconds range, followed closely by 0-30 seconds and 61-120 seconds.
- Engagement sharply declines for longer session durations.

Insights and Considerations
- Peak Engagement in 31-60 Seconds:
- With 14,000 sessions in this bucket, users are engaging slightly longer than the initial visit but may require incentives or engaging content to extend their stay further.
- With 14,000 sessions in this bucket, users are engaging slightly longer than the initial visit but may require incentives or engaging content to extend their stay further.
- Drop-Off Beyond 2 Minutes:
- Session counts decrease significantly after 2 minutes, with only 6,000 sessions in the 121-300 seconds range and fewer beyond 5 minutes. This indicates potential opportunities to improve content or user flows to sustain engagement.
- Session counts decrease significantly after 2 minutes, with only 6,000 sessions in the 121-300 seconds range and fewer beyond 5 minutes. This indicates potential opportunities to improve content or user flows to sustain engagement.
- Low Long-Term Engagement:
- Only 200 sessions last between 10-30 minutes, and 20 sessions exceed 30 minutes. While these long sessions are rare, they may represent a highly engaged audience worth nurturing.
- Only 200 sessions last between 10-30 minutes, and 20 sessions exceed 30 minutes. While these long sessions are rare, they may represent a highly engaged audience worth nurturing.
Actionable Recommendations
- Improve Early Engagement:
- Focus on converting users in the 0-30 seconds bucket by ensuring faster load times, clearer calls-to-action, and compelling landing pages.
- Focus on converting users in the 0-30 seconds bucket by ensuring faster load times, clearer calls-to-action, and compelling landing pages.
- Extend Mid-Session Engagement:
- Optimize content or navigation for users in the 31-120 seconds range to retain them for longer durations.
- Use targeted prompts, such as recommended actions or personalized offers, to sustain engagement.
- Analyze Long Sessions:
- Investigate the behavior of users in the longer-duration buckets (301 seconds and beyond). These could be your most loyal or high-value users, ideal for personalized campaigns.
- Investigate the behavior of users in the longer-duration buckets (301 seconds and beyond). These could be your most loyal or high-value users, ideal for personalized campaigns.
Conclusion
By using the RANGE_BUCKET function in BigQuery, businesses can categorize and analyze session durations effectively. The insights from this analysis provide a clear roadmap for enhancing user engagement and retention strategies. Let me know if you’d like to expand this analysis further or explore additional datasets!
It is true that it is possible to achieve the same report with GA4, but with BigQuery the spectrum of flexibility and customisation is much broader.
In GA4: the predefined reports offer an immediate but limited view of what has been configured by Google. It is possible to modify dimensions and metrics, but within certain limits.
In BigQuery: You have direct access to the raw data, which you can manipulate without limits. You can create highly customised queries to segment data according to your company-specific logic (e.g. customised buckets, specific calculations, merging with other datasets). With BigQuery, it is possible to analyse the duration of sessions by segmenting them according to device type, geographic area or custom events defined for your use case. This level of granularity is not always available in GA4 reports, not to mention the problem of data sampling.


 Digital Analytics Expert
 HTML, CSS & JS Lover
 Apps Script Developer
 Problem-Solving Oriented


Commenti recenti